Dagster - Data Orchestration
No AI Content
The Project
This project is a simple mock-up project for a data pipeline built with Dagster. I am by no means an expert in data pipelines — or in Dagster, for that matter — but it’s a good excuse to tell you about this neat and handy piece of software, and for me to gain more hands-on experience with it.
I stumbled upon Dagster while looking for ways to manage data for a personal project I wanted to set up. The project involved crawling data, inserting it into a database, transforming it, and then analyzing it further to generate reports. A perfect use-case for Dagster, as it turns out.
The project shared here is a mock-up of that idea. Instead of crawling data from a real source, it retrieves data from a mock API. Dagster manages the crawling, inserts the data into a PostgreSQL database, and then generates a HTML plot using Plotly. If you prefer to try it out yourself or just want to look at the code, you can check it out on GitHub here:
dagster-data-analysis
The dagster project on GitHub.
The Scenario
The project runs using multiple Docker containers. There is one container for each service: The database, Dagster, the mock API, and Nginx, which is used to serve the final result. The Dagster WebUI, Nginx and Mock API are exposed to the user.
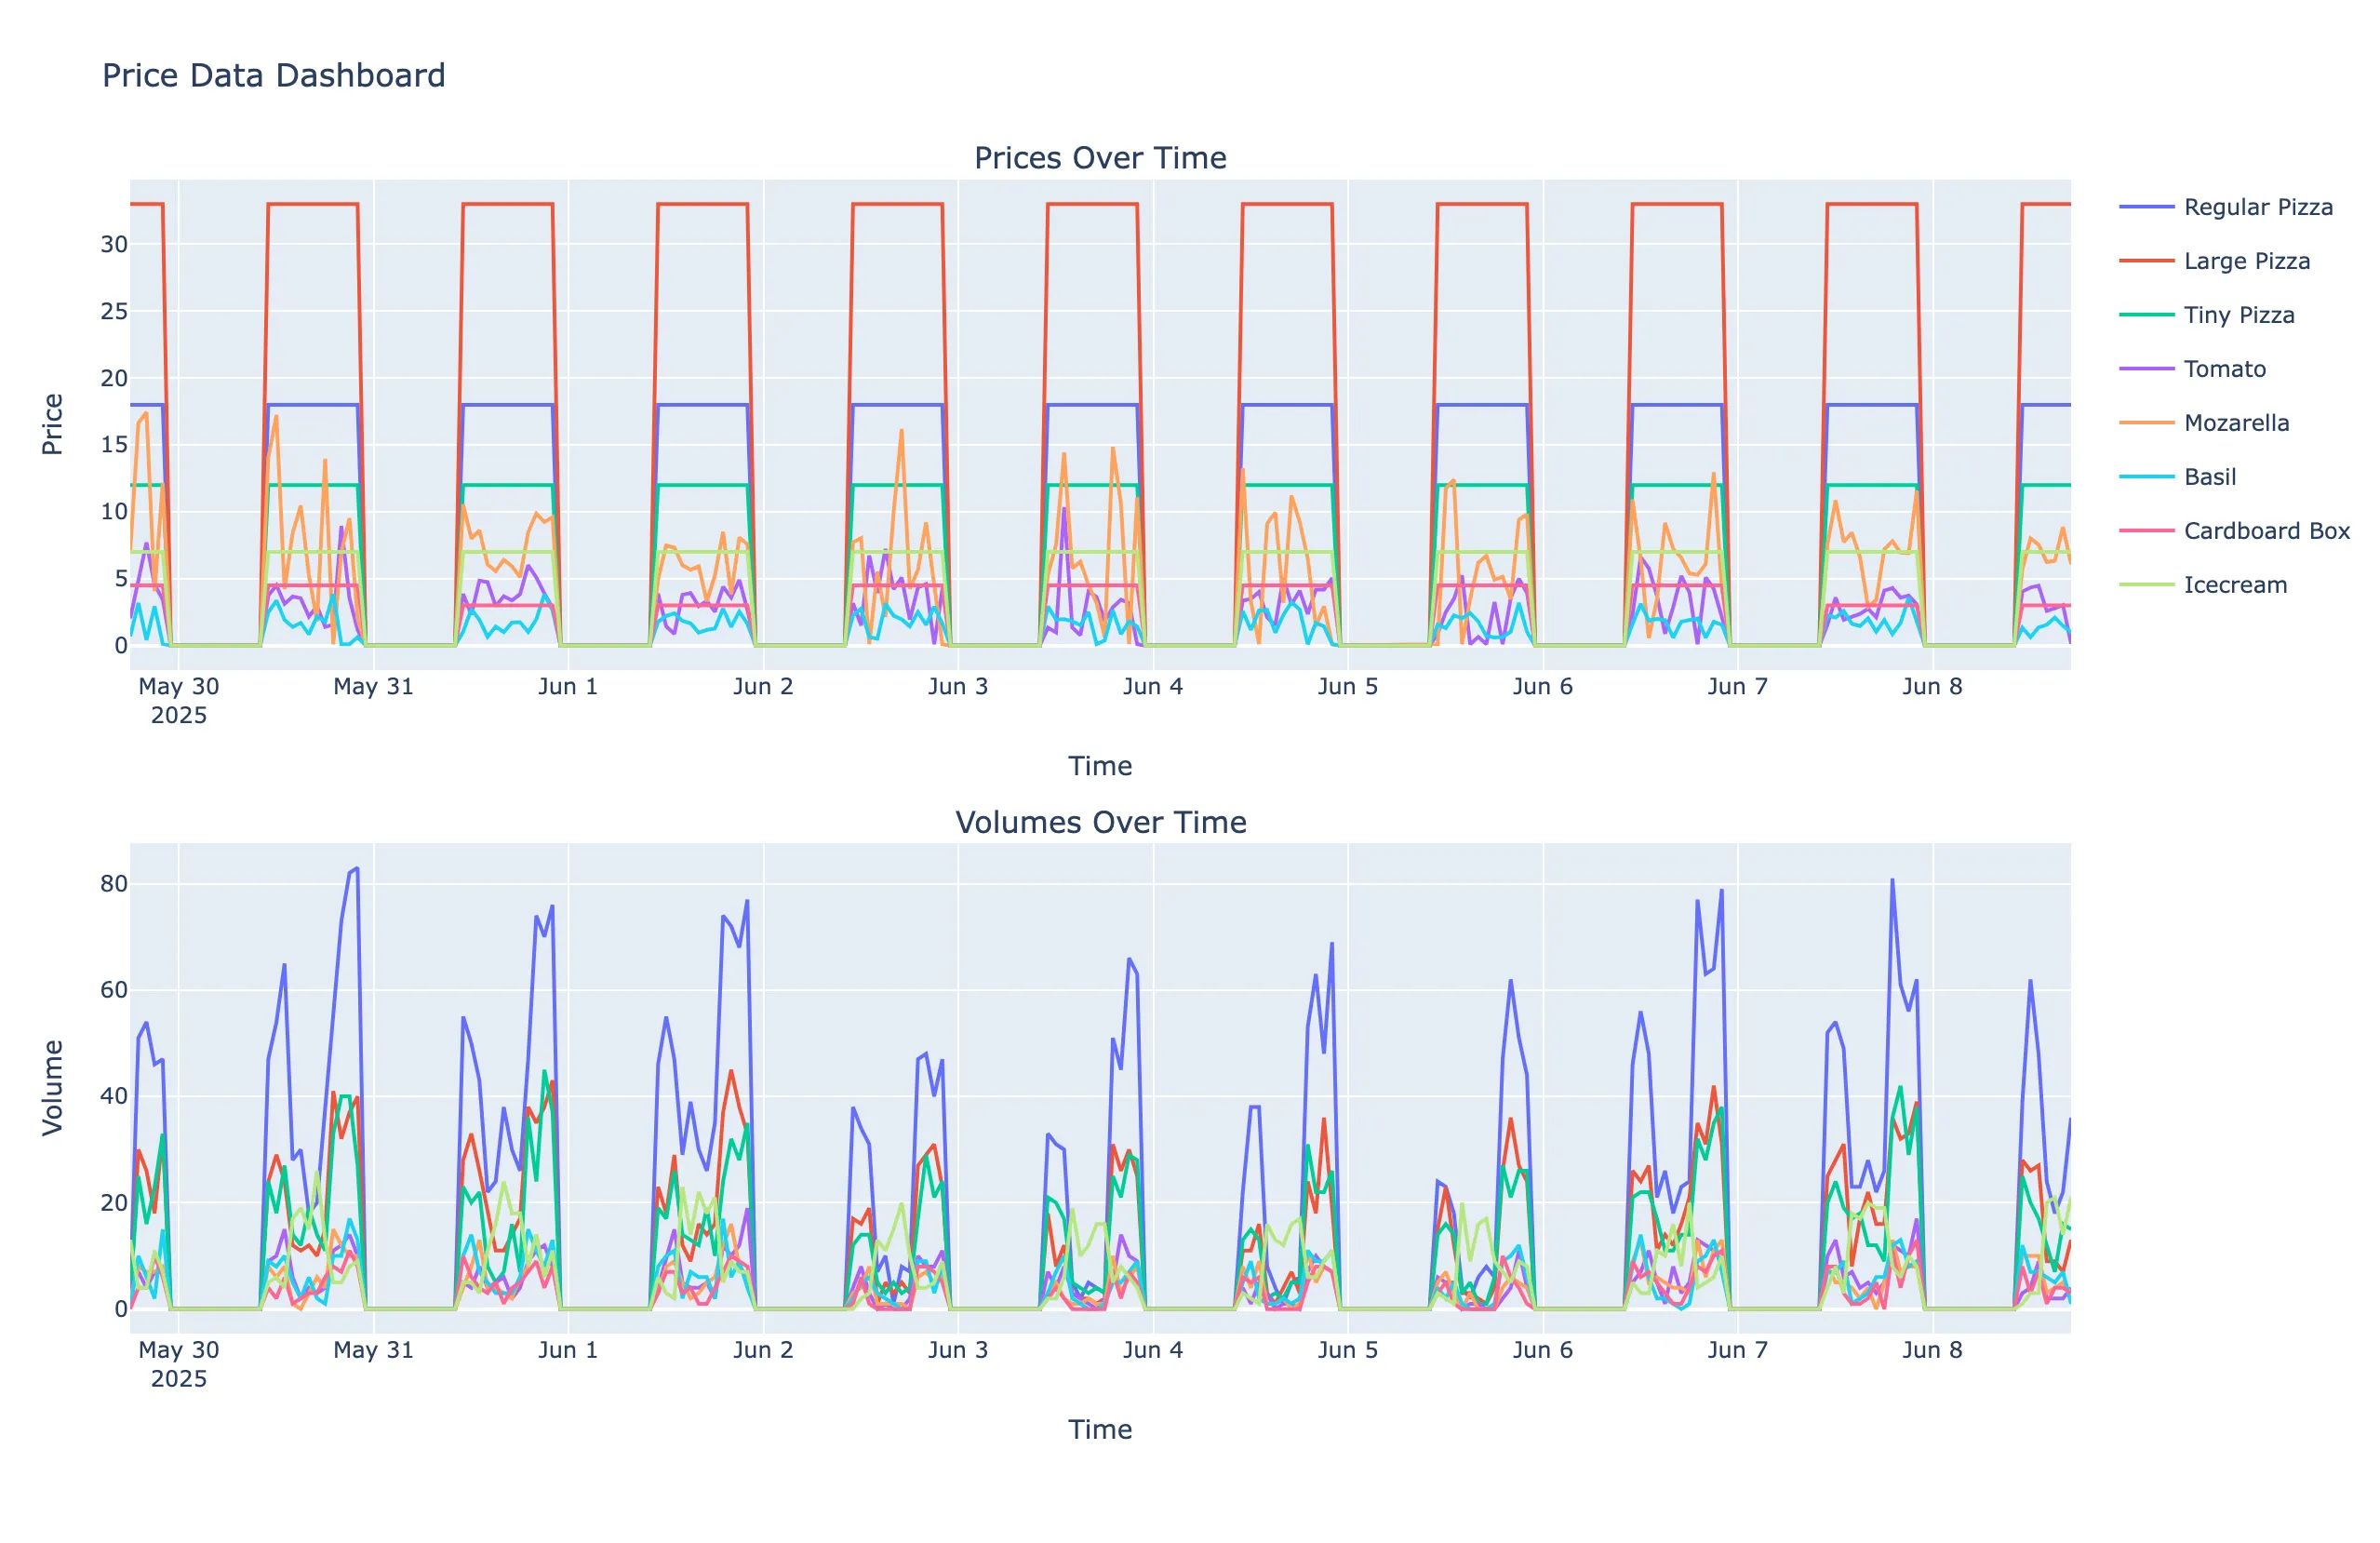
The Mock API serves prices and trading volumes for various predefined items. The theme is a pizza restaurant: users get prices for pizzas, ingredients, and other products. Each item has its own random processes determining the prices and volumes. The current version only displays the crawled prices at the end of the pipeline. A future version (or one you, the reader, could build, if you’re up for a challenge) might include fitting the data and generating forecasts.
Dagster
If you are curious, here are a few core concepts used in Dagster:
Assets
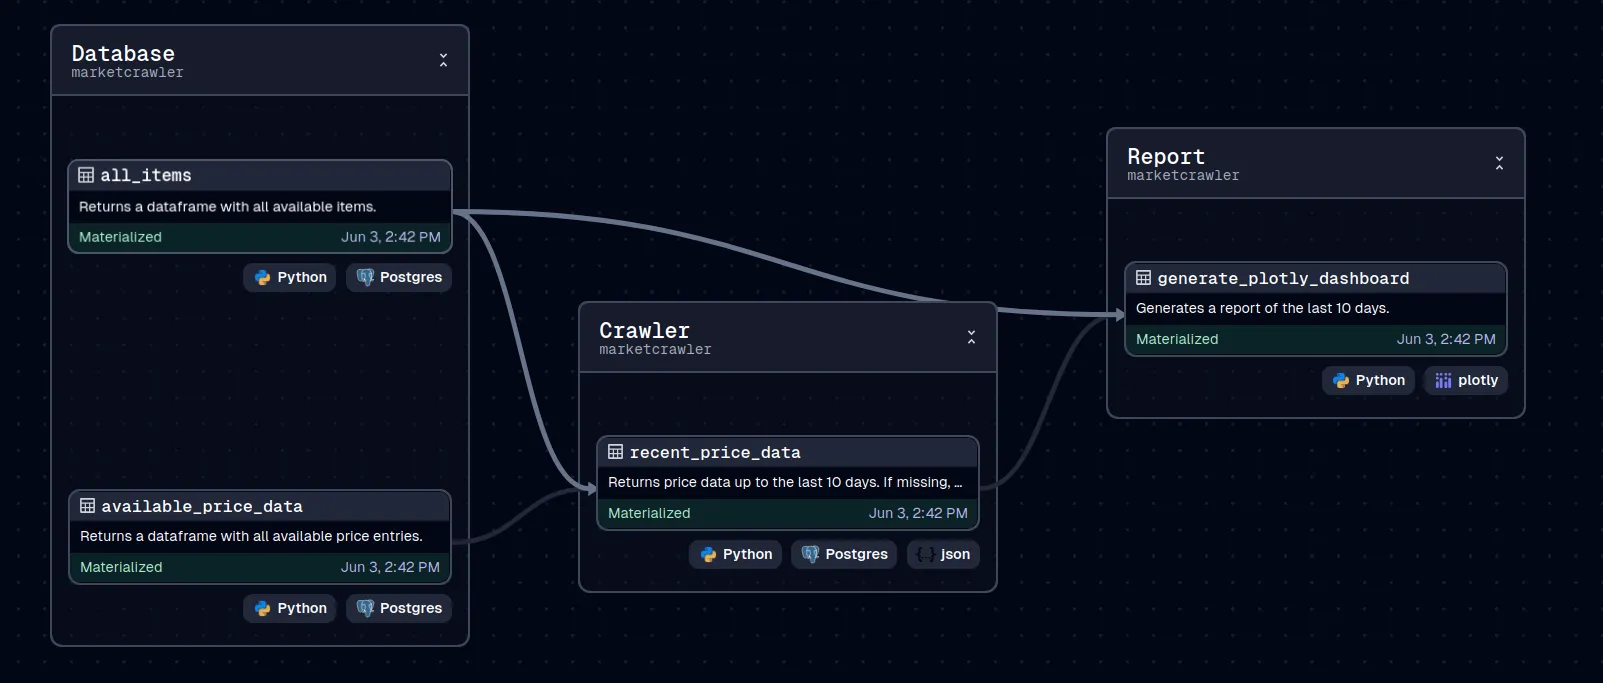
One of the central concepts is the asset1. An asset represents an observation of data — like a table or file (e.g., a pandas dataframe or an HTML file in this project). It is defined by code that generates and manages the observed data. Assets can depend on other assets. For example, a table output (the first asset) can be further transformed into a plot file (a downstream asset). Turning an asset into it a concrete observation (in other words, running the code) is called materializing the asset.
In the screenshots above, all nodes represent assets, and the lines between them represent the dependencies.
There neat thing about using multiple assets is that the pipeline can be executed partially. If the crawling step succeeded, but the plot generation failed, we don’t need to re-run the crawling step. We can fix the problem and re-materialize the plot asset.
Another benefit is speed: if assets don’t depend on each other, Dagster runs them in paralell. Each asset materialization has its own logs, error messages, and metadata — which is extremely helpful.
Resources, Jobs, Automation, Sensors
Resources are used when Dagster needs to interact with external systems like databases or APIs. They usually require configuration (e.g., usernames, passwords) that is shared between different assets.
A job2 is collection of connected assets. It’s the main unit of execution and allows you to trigger the entire pipeline with one click. Jobs can also be automated.
Automation is possible via:
- Schedules (e.g., cron expressions)
- Dependency updates (e.g., re-run if inputs have changed)
- Sensors, which monitor for events or external signals
Sensors run on a schedule, checking for certain conditions. Based on their findings, they can trigger or skip jobs. These events can come from within Dagster (e.g., other runs meeting criteria) or from external systems (e.g., new data in an API).
Footnotes
Footnotes
-
Dagster Docs on Asssets: https://docs.dagster.io/guides/build/assets/. ↑
-
Dagster Docs on Jobs: https://docs.dagster.io/guides/build/jobs/. ↑